Running WAVE Assessment
Initial Thoughts
The very first thing I noticed after running the WAVE assessment is that even though it’s to mark all places that have errors, context errors, structures, etcetera, it looks very messy, it was a little confusing to figure out what was happening.
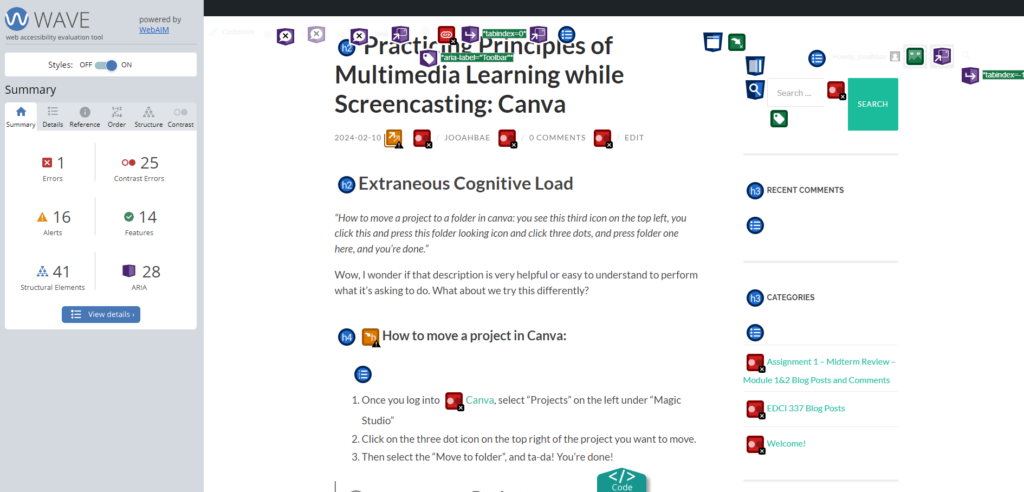
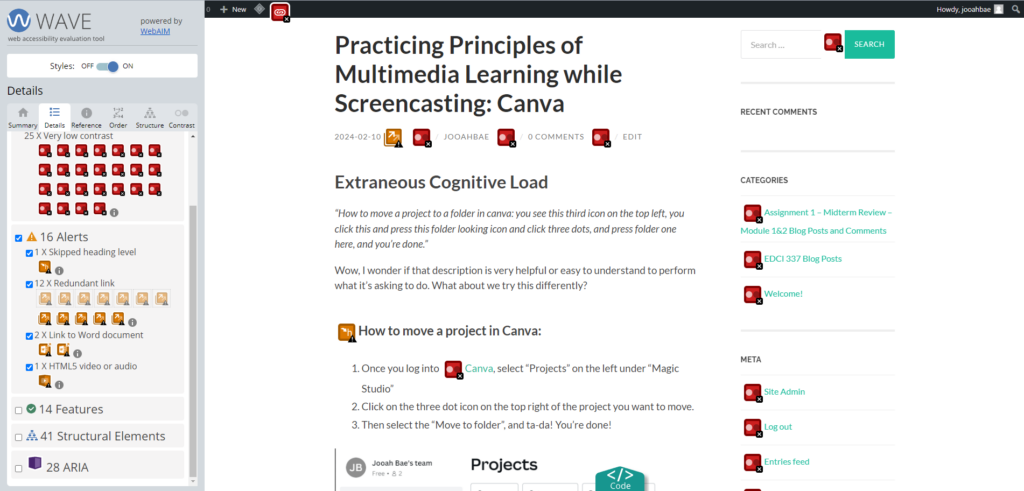
Once I got used to using this tool, I unchecked the areas where it had features, structural elements, and ARIA, and this is what it looked like.
I was surprised it had a lot fewer errors than expected from the first messy, confusing screen. Did not think the default colour of the site directories and button being light green with the white font was going to be a colour contrast error so that part was interesting. After realizing this, I thought maybe some people with visible impairment might have trouble reading the context in these colour mix.
Possible Improvements
I like how the WAVE assessment shows people a room for improvement on their page. However, limiting the default showing icons to only errors and alerts would be a nice start until the user selects further options – it could help with the user getting clearer views of things and not as fatigued as the current default option. Otherwise, I liked how it helped me realize the colour mix that I thought was cute might be troublesome to some who are visibly impaired.
Infographic with Canva
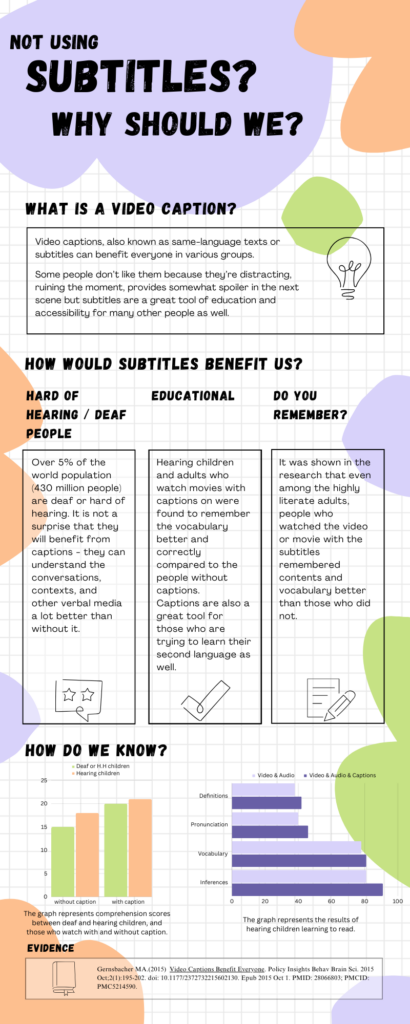
While I was reading the contents in Module 2, I found this one article that was about using subtitles and showing results between deaf/hard of hearing people and hearing people with and without subtitles. As a deaf person who prefers to have subtitles on most of the things I watch, I got interested and decided to make an infographic out of this article.
Reading Infographic for Visibly Impaired People
Although I have never used the text-to-speech tool as I’m deaf and I prefer to read than hear sounds, I believe this option would be great for those who are visibly impaired. The use of text-to-speech assistant technology such as screen readers would help them attain information from infographics that are very visual-heavy. Avoiding the use of small texts or colours that many colour-blind people can’t see is another way of making infographics disability-friendly.
Hi Jooah!
Your infographic was really well done! I’m impressed with the amount of research you’ve put into it. The visuals are also very useful to help emphasize some of your points. I’m a fan of how you grouped the information. It makes it very easy to understand where I’m supposed to look next. Great job on including some alt text on your figures.
One aspect that I personally think could use some improvement is the choice of background. The graph paper background aesthetically is nice, but I feel that it might be a bit too busy.
For the WAVE report, I found that we had similar thoughts, most likely due to using the same template. I was also surprised at the contrast error with the light green text, especially since we both found that it was contrasting enough.
I’m looking forward to your next blog post!